CNI Benchmark: Understanding Cilium Network Performance
Understanding Cilium Network Performance
Hello 👋
As more crucial workloads are being migrated to Kubernetes, network performance benchmarks are becoming an important selection criteria when deciding what network layer to leverage in a Kubernetes cluster. In this blog post, we'll explore the performance characteristics of Cilium based on extensive benchmarks that we have run in the past few weeks. Upon popular request, we are also including measurements for Calico to allow for a direct comparison.
However, instead of just presenting the numbers, we are going to dive into the topic of container networking benchmarking a bit deeper and look at:
- The Throughput Benchmark
- Does Container Networking add Overhead?
- Breaking the Rules: eBPF Host-Routing
- Measuring Latency: Requests per Second
- Comparing CPU Flamegraphs Cilium eBPF vs Calico eBPF
- Rate of new Connections
- The Cost of Encryption - Wireguard vs IPsec
- How to reproduce the results
- Performance Impact of a Sidecar
Summary of the Results
Before we dive into the detailed numbers and benchmarks, the following list is a summary of our findings. Feel free to skip it if you want to derive your own conclusions after reading the details first.
-
eBPF makes the difference: While Cilium has an edge over Calico's eBPF datapath in some areas, e.g. latency as observable in
TCP_RRandTCP_CRRbenchmarks. The more fundamental takeaway is that eBPF is clearly superior to iptables. Cilium and Calico running in a configuration allowing to bypass iptables using eBPF both significantly outperform the versions which cannot.Looking into the specific details we find that Cilium and Calico don't leverage eBPF in exactly the same way. While some concepts are similar (which is not entirely surprising given the open-source nature), CPU flamegraphs reveal that Cilium is taking advantage of additional context-switching savings which likely explain the difference in
TCP_RRandTCP_CRRresults.Overall, based on the benchmark results, eBPF is clearly the best technology to address the challenging cloud-native requirements.
-
Observability, Network Policy, and Services: For this benchmark, we have focused on the lowest-common denominator which is essentially networking only. This also allows to directly compare the results to node networking. However, real-world usage will also require observability, network policy and services. This is where the Cilium and Calico eBPF datapaths will differ extensively. Cilium supports several additional features not found in the Calico eBPF datapath, but even for the standardized features such as Kubernetes NetworkPolicy, the implementations differ and we will likely find significant performance differences as a substantial amount of work has to be performed using eBPF for these more advanced use cases. However, the post is already long enough as-is so we'll reserve digging into these measurements and details to a follow-up post.
-
Wireguard vs IPsec: Somewhat surprising, even though Wireguard has been able to achieve higher maximum throughputs in our tests, IPsec can be more efficient in terms of CPU resources to achieve the same throughput. This is very likely strictly dependant on the availability of AES-NI CPU instructions which allow to offload the crypto work for IPsec whereas Wireguard cannot benefit from this. The cards will obviously turn when AES-NI offload is not available.
The good news is that starting with Cilium 1.10, you have the choice to run either. Cilium now supports Wireguard in addition to IPsec.
The Throughput Benchmark
The usual benchmarking disclaimer:
Benchmarking is hard. Results can vary based on the hardware tests are run on. Absolute numbers should not be compared unless results have been gathered on identical systems.
Let's start with the most common and obvious benchmark, the infamous TCP throughput metric measuring the maximum data transfer rate between containers running on different nodes:
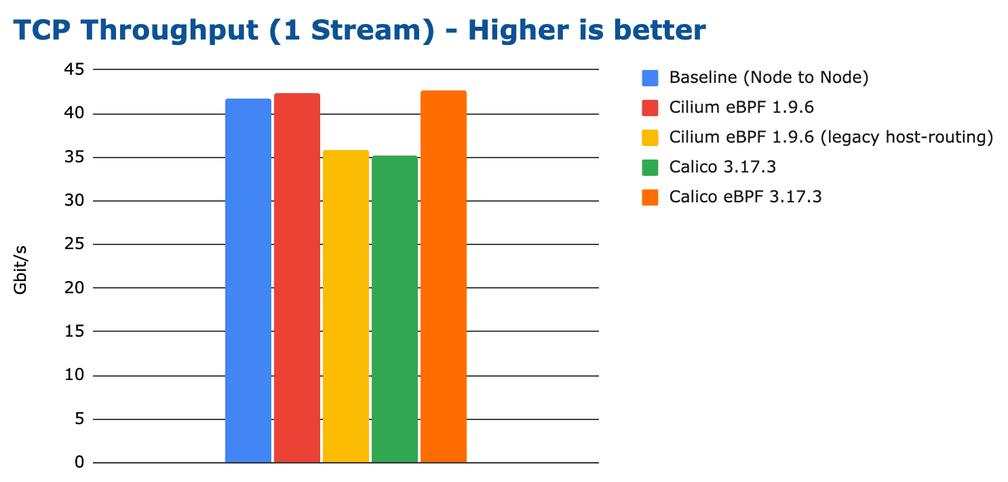
The above graph shows the maximum throughput that can be achieved with a single
TCP connection. The best performing configurations top out just over 40Gbit/s.
It has been measured by running netperf using the TCP_STREAM test. We are
using a 100Gbit/s network interface to ensure that the network card is not the
bottleneck. Due to running a single netperf process transmitting over a
single TCP connection, most of the network processing is done using a single
CPU core. This means that the above number is constrained by the available CPU
resources of a single core and thus nicely highlights how much throughput can
be achieved with each configuration when the CPU is the bottleneck. We'll
expand this test further down in the blog by throwing more CPU cores at the
problem to remove the CPU resources constraint.
Did you notice that the high-performing eBPF implementations can a throughput even slightly higher than the node-to-node baseline? How is this possible? It is somewhat unexpected because container networking is generally believed to add overhead compared to node to node networking. Let's hold this thought for a moment, we'll explore this aspect as we dig deeper.
CPU resources required to transfer 100Gbit/s
The results for the TCP_STREAM benchmark already hinted which configurations
are the most efficient to achieve high transfer rates but let's look at the
overall system CPU consumption while the benchmark is running:
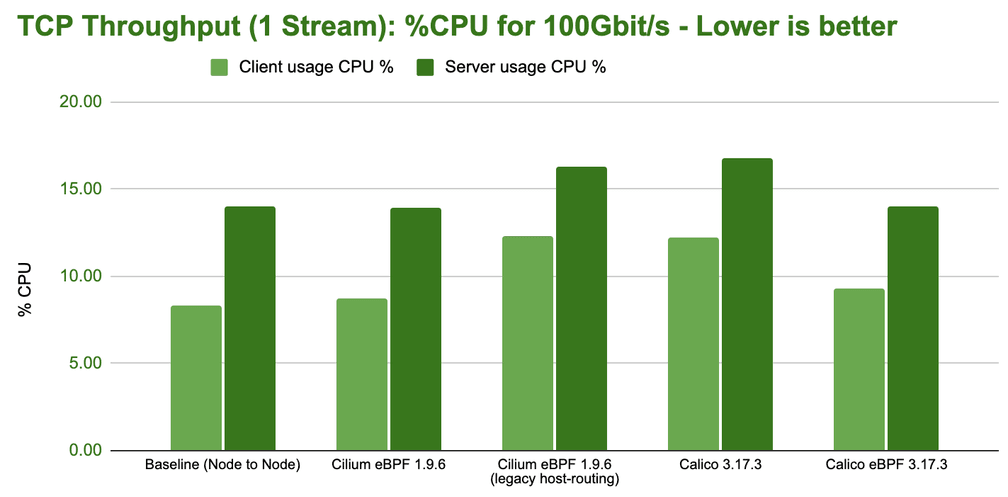
The above CPU usage graph represents the system-wide percent of CPU required to deliver 100Gbit/s of throughput. Note that this is not the CPU consumption for the throughput reported in the previous graph, the CPU usage has been normalized for all results to represent a steady 100Gbit/s transfer rate to make the numbers directly comparable. The lower the bar in the above graph, the more efficient a configuration is in transferring 100Gbit/s.
Random kernel wisdom: TCP flow performance is generally limited by the receiver, since the sender can use both TSO super-packets. This can be observed in the increased CPU spending on the server-side in the above tests.
What do TCP throughput benchmarks represent?
While the majority of users are unlikely to routinely experience this level of throughput, certain types of application will care for this type of benchmark:
- AI/ML applications requiring access to large amounts of data
- Data upload/download services (backup services, VM images, container registries, ...)
- Media streaming services, in particular for 4K+
We'll dive into Measuring Latency: Requests per Second and Rate of new Connections later on in this post which better represent typical microservices workload.
Does Container Networking add Overhead?
The initial benchmark indicates that there is some overhead when performing container networking compared to node networking. Why is this? Let's look at the two networking models from an architecture perspective:
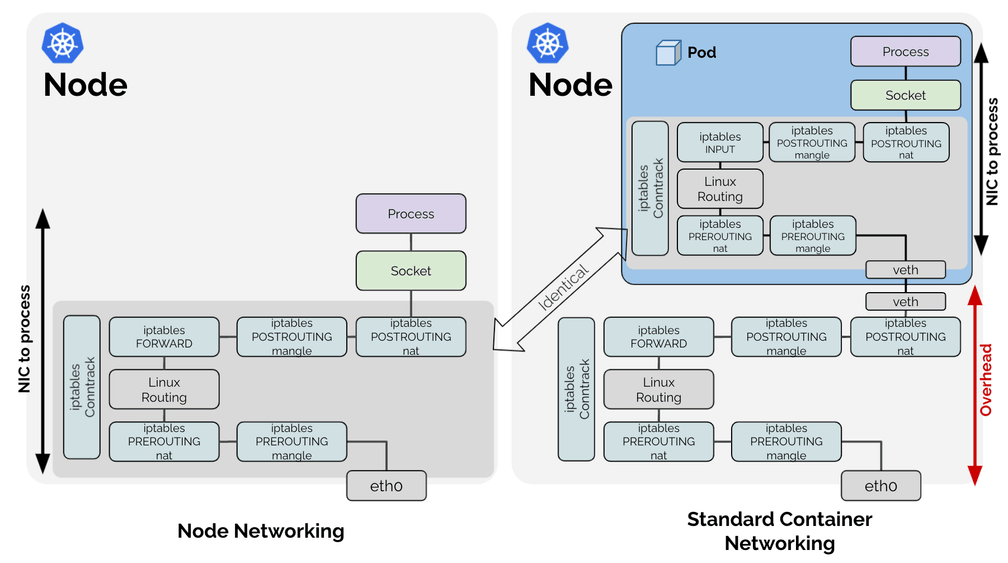
What stands out in the above diagrams is that the entire networking processing path that is required for node-to-node networking, is also done for container networking case, just inside of the network namespace of the container (dark blue box).
Given that all work required for the node network processing is also required within the container network namespace, any work done outside of the container network namespace is basically overhead. The above diagram shows the network path when Linux routing with Virtual Ethernet (veth) devices are used. It may look slightly different if you use a Linux bridge or OVS, for example, but the fundamental overhead point is shared between all of them.
Breaking the Rules: eBPF Host-Routing
You may be wondering about the difference between the configurations "Cilium eBPF" and "Cilium eBPF (legacy host-routing)" in the benchmarks before and why the native Cilium eBPF datapath is considerably faster than the legacy host routing. When referring to the Cilium eBPF native datapath, an optimized datapath called eBPF host-routing is in use:
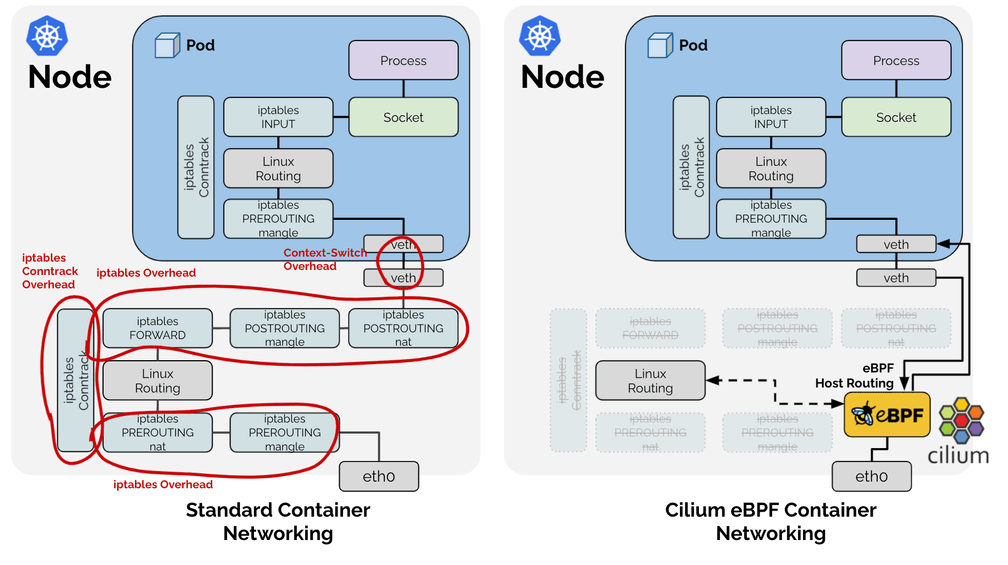
eBPF host-routing allows to bypass all of the iptables and upper stack overhead in the host namespace as well as some of the context-switching overhead when traversing through the Virtual Ethernet pairs. Network packets are picked up as early as possible from the network device facing the network and delivered directly into the network namespace of the Kubernetes Pod. On the egress side, the packet still traverses the veth pair, is picked up by eBPF and delivered directly to the external facing network interface. The routing table is consulted directly from eBPF so this optimization is entirely transparent and compatible with any other services running on the system providing route distribution. For information on how to enable this feature, see eBPF Host-Routing in the tuning guide.
Calico eBPF is applying some of the same bypasses to iptables but as we'll learn later on, is not quite identical. However, it proves that the most impact can by made by bypassing slow kernel subsystems such as iptables.
Pushing for 100Gbit/s Line-Rate
Earlier in the blog post, we looked at results while mostly involving just a
single CPU core in all of the processing. Let's open up the flood gates and
parallelize TCP streams and run multiple netperf processes:
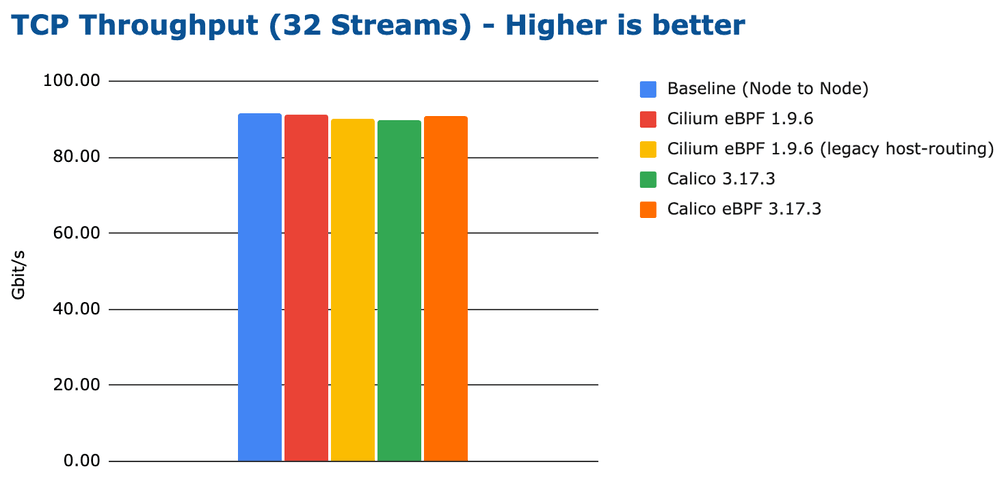
Note: We have specifically chosen 32 processes due to the hardware featuring 32 threads, to ensure that the system can evenly distribute the load.
This graph is kind of boring. It shows that if you throw enough CPU resources at the problem, all tested configurations can achieve close to 100Gbit/s line-rate. However, looking at the CPU resources, we can still identify a difference in efficiency:
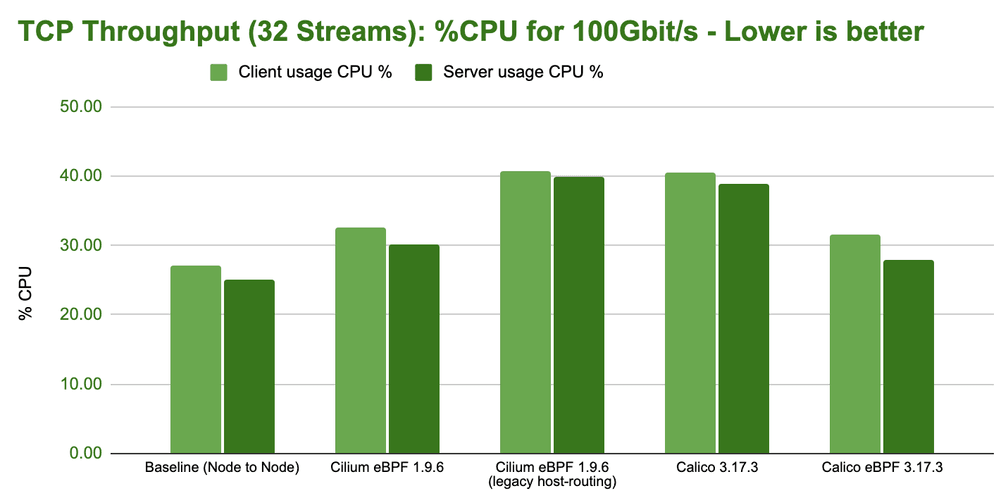
Note that the CPU usage measurement includes the entire CPU consumed, this also
includes the netperf processes running so it also includes the CPU typically
required by workloads to perform the network I/O. It however does not include
any business logic that the application would typically perform.
Measuring Latency: Requests per Second
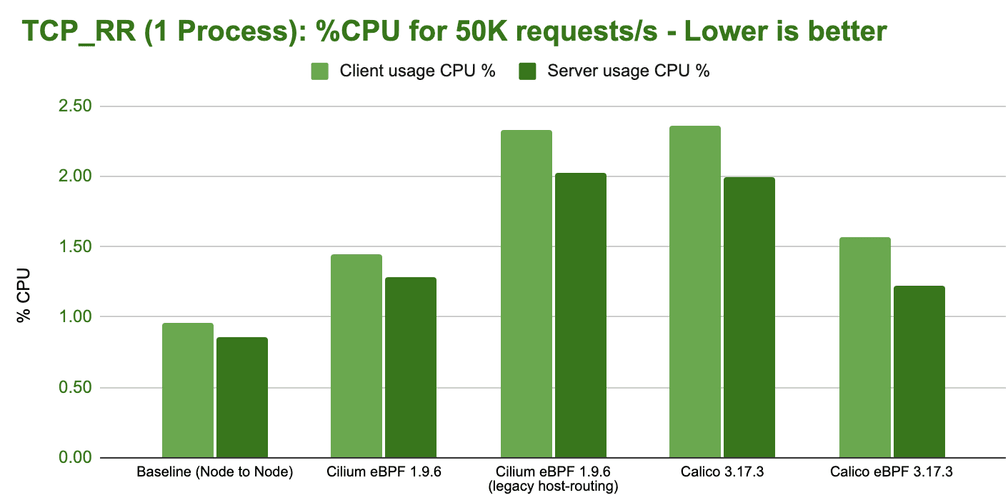
The requests per second metric is almost the exact opposite of the throughput metric. It measures the rate of single byte round-trips that can be performed in sequence over a single persistent TCP connection. This benchmark highlights how efficiently a single network packet can be processed. The lower the latency for an individual network packet, the more requests can be processed per second. Optimizing between throughput and latency is often a trade-off. To achieve maximum throughput, large buffer sizes are ideal but these large buffer sizes can lead to an increase in latency. This is called buffer bloat. Cilium contains a feature called Bandwidth Manager which automatically configures fair queueing, optionally allows for EDT-based Pod rate-limiting, and optimizes TCP stack settings for server workloads to strike the best possible balance between the two.
This benchmark is often overlooked but it is usually a lot more relevant to users as it models a pretty common usage pattern for microservices: request and responses exchanged between services using persistent HTTP or gRPC connections.
Let's look at how the different configurations perform when a single
netperf process performs a TCP_RR test:
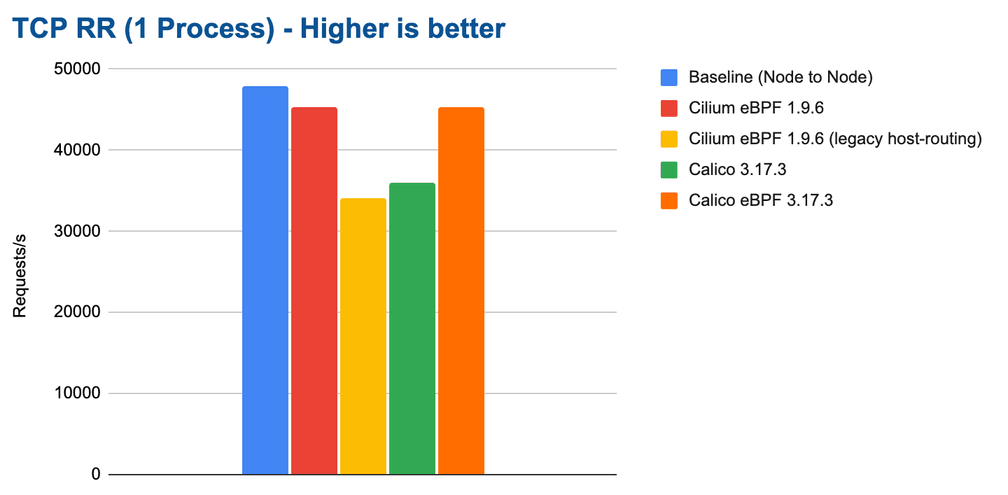
Configurations that perform better in this test also deliver lower average latencies. However, it does not directly allow to draw conclusions on P95 or P99 latencies. We will look into them in a future blog post.
As we expand the test to run 32 parallel netperf processes to scale out and
utilize all available CPU cores, we can see that all configurations are able to
scale up accordingly. However, unlike for the throughput tests, throwing more
CPU at the problem does not allow to catch up on the difference in efficiency
because the maximum rate is limited by the latency and not the available CPU.
We would only see identical requests if the network bandwidth became the
bottleneck.
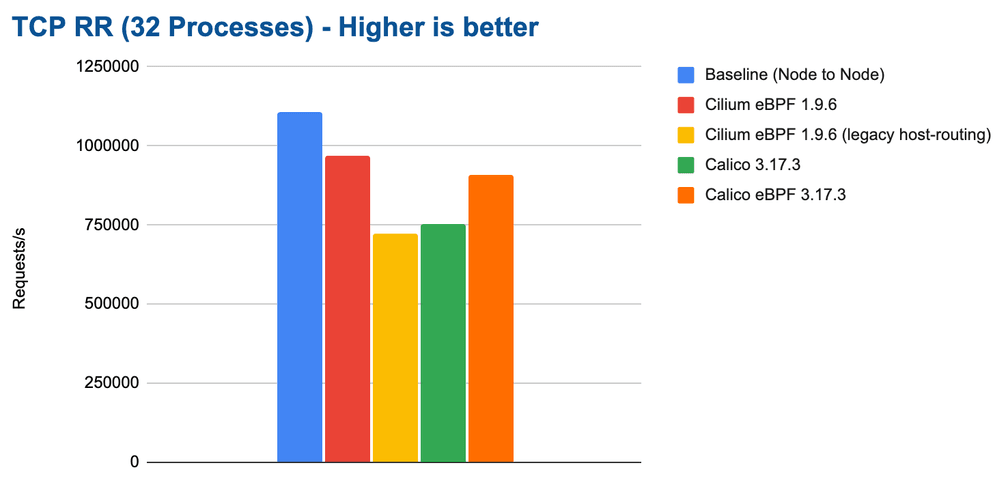
Overall, the results are quite encouraging, Cilium can achieve almost 1M requests/s on our test system with eBPF host-routing.
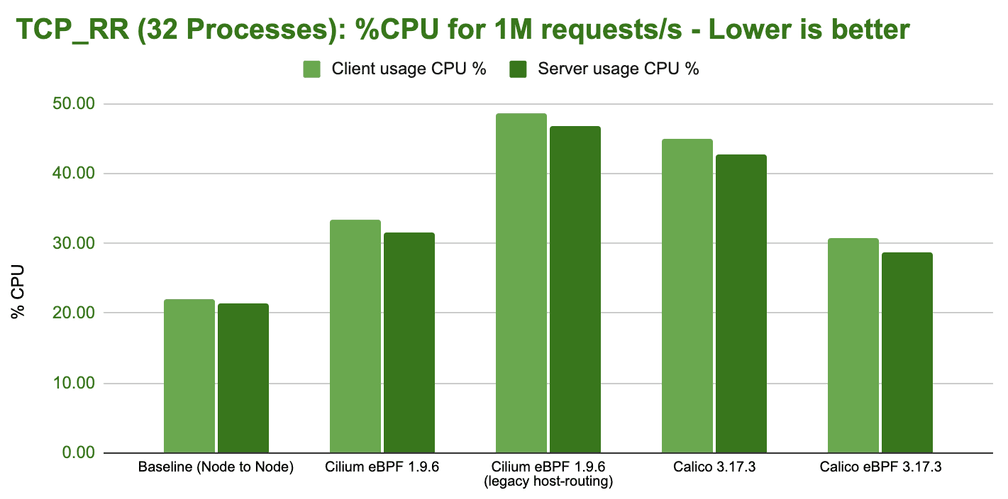
Comparing CPU Flamegraphs Cilium eBPF vs Calico eBPF
Overall, the performance for Cilium eBPF and Calico eBPF are relatively similar, are they using the same datapath? Not really. There is no such thing as a pre-defined eBPF datapath. eBPF is a programming language and runtime engine that allows to build datapath features among many other things. The Cilium and Calico eBPF datapaths differ quite significantly. In fact, Cilium offers a wide range of features which are not supported by Calico eBPF. But even on the interaction with the Linux networking stack, the two show significant differences. Let's look at CPU flamegraphs to dig in a bit:
Cilium eBPF (Receive Path)
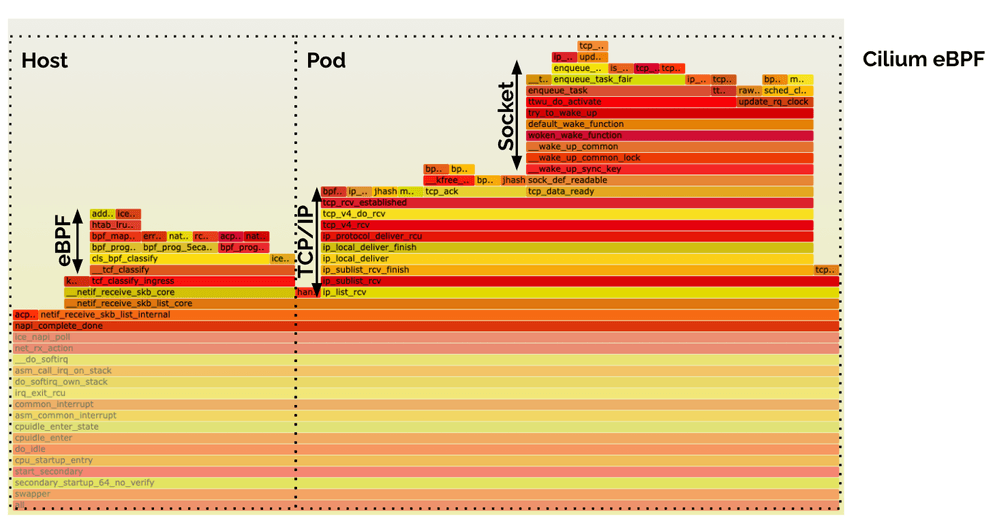
The eBPF host-routing implementation of Cilium features a nice context-switch free delivery of data from the NIC all the way into the socket of the application. That's why the entire receive-side path fits nicely into a single flamegraph above. You can see the processing blocks for eBPF, TCP/IP, and the Socket.
Calico eBPF (Receive Path)
The Calico eBPF receive side does not look quite the same. There is an identical eBPF block which executes the eBPF program. Then there is an additional Virtual Ethernet (veth) traversal which is not required on the receive side in Cilium's eBPF datapath.
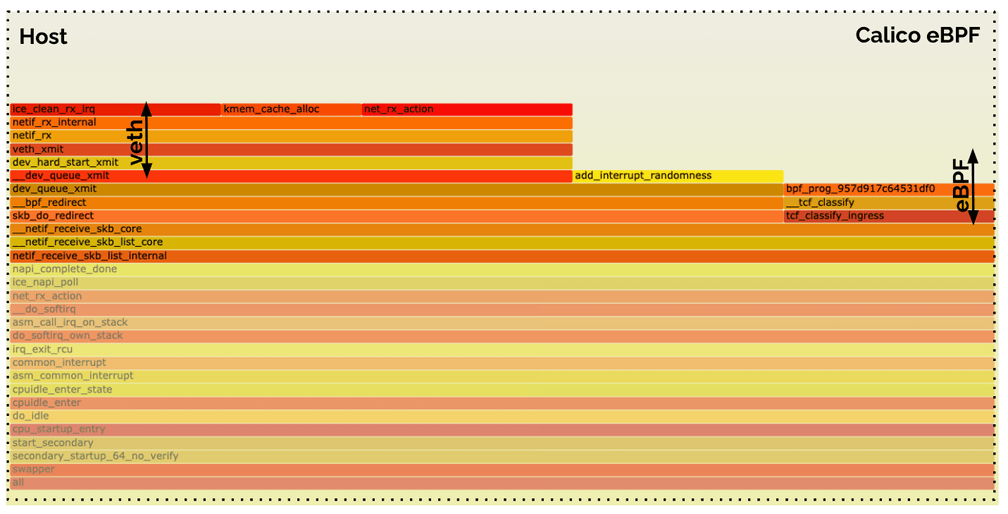
All of the above is still performed in the context of the host. This following
second flamegraph highlights the work done in the pod itself. It shows the work
performed as resumed by process_backlog. It is the same work (TCP/IP + socket
delivery) as in the Cilium case, but after an additional context switch due to
the veth traversal.
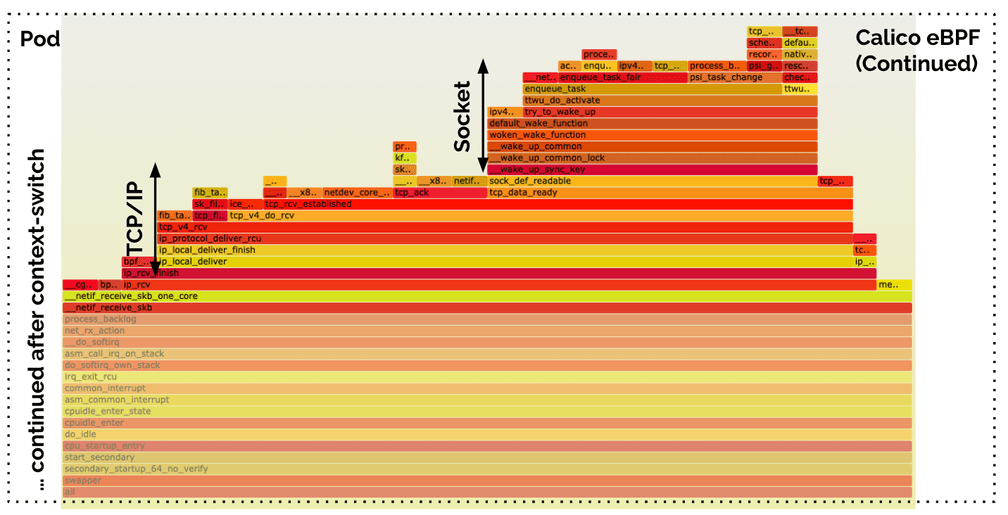
If you want to dig deeper yourself, open the below links in your browser for the interactive SVG versions of the images that will allow to zoom in:
- Cilium eBPF Flamegraph SVG - Sender
- Cilium eBPF Flamegraph SVG - Receiver
- Calico eBPF Flamegraph SVG - Sender
- Calico eBPF Flamegraph SVG - Receiver
Rate of new Connections
The connection rate benchmark builds on top of the requests per second benchmark but initiates a new connection for each request. This benchmark highlights the difference between using persistent connections and opening new connections for each request. Handling new TCP connections requires work to be performed in various parts of the system; this test is therefore by far the most stressful for the entire system. We will see that it is possible to actually consume the majority of the available system resources with this benchmark.
This test represents a workload that receives or initiates a lot of TCP connections. An example where this is the case is a publicly exposed service that receives connections from many clients. Good examples of this are L4 proxies or services opening many connections to external endpoints such as a data scraper. This benchmark puts the most stress on the system with the least work offloaded to hardware, so we can expect to see the biggest differences between tested configurations.
In a first test, we run a single netperf process using the TCP_CRR test:
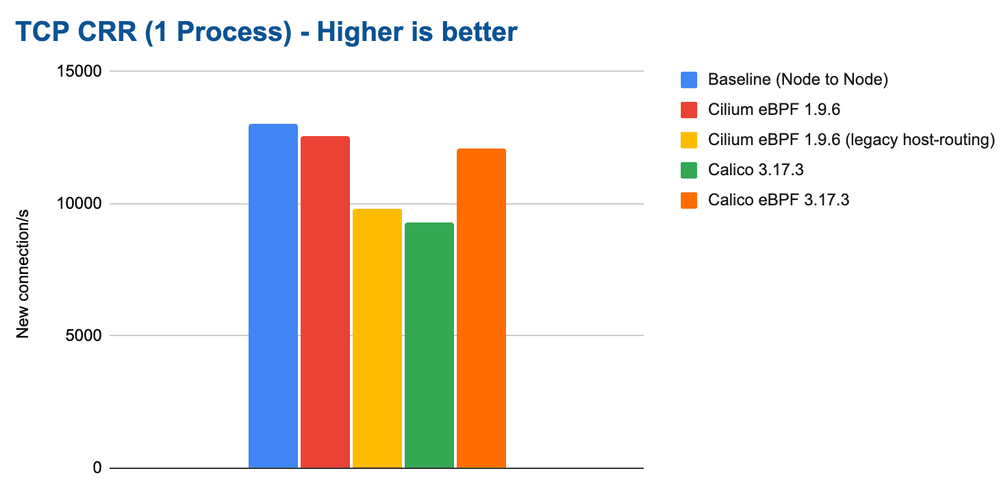
The difference is already quite severe for a single process and it will amplify as we scale out to more CPU cores. It's also clear that Cilium can again almost compensate for the additional network namespace overhead and almost match the baseline.
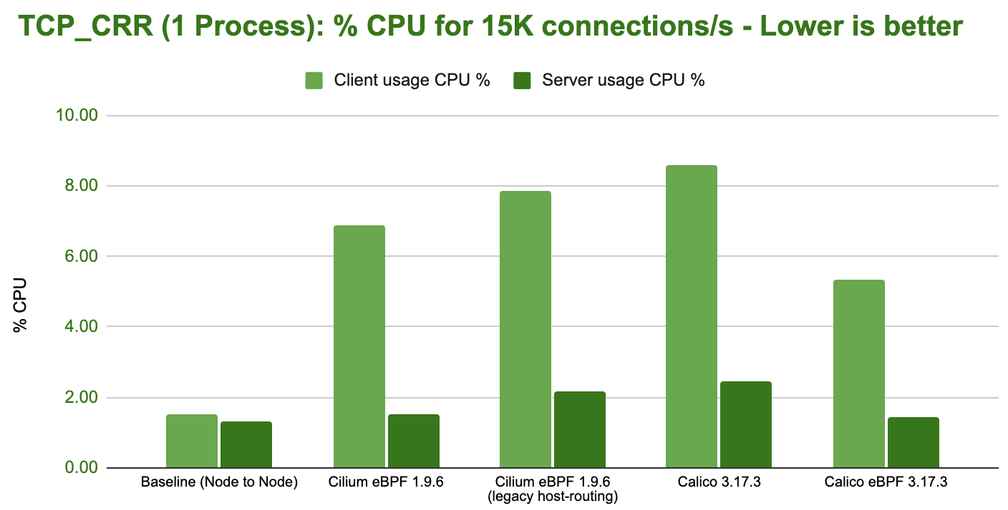
Future work scheduled: The CPU resource usage was a surprise to us and lead us to schedule further investigation for the 1.11 development cycle. There seems to be a cost paid on the sender side as soon network namespaces get involved. This cost is paid by all configuration that involve network namespaces so it is likely caused by the kernel datapath portion shared by both Cilium and Calico. We'll provide an update as soon as we have learned more about this.
As we scale out the test to run on all CPU cores by running 32 parallel
netperf processes using TCP_CRR, an interesting observation can be made:
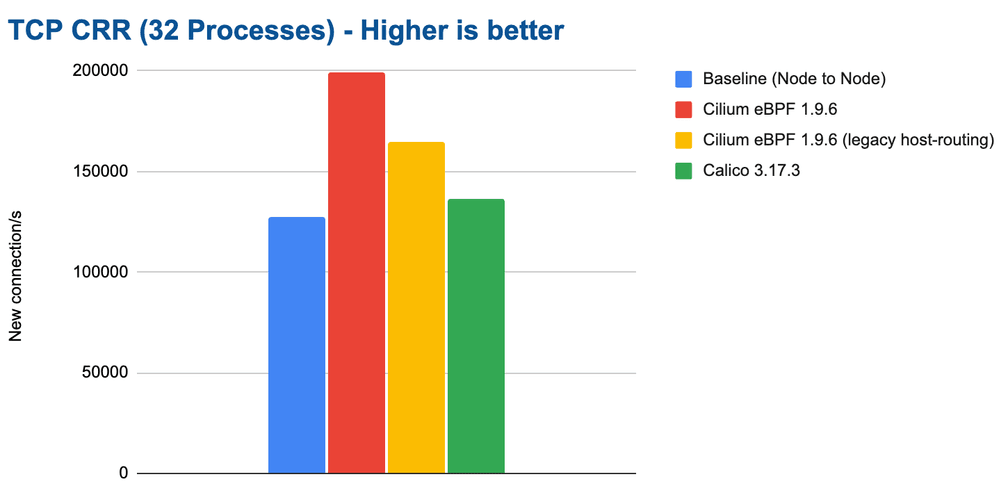
The connection rate for the baseline drops significantly. It is not able to
scale with the additional CPU resources available. This is despite the
connection tracking table sized accordingly and us validating that no drops had
occurred due to the connection tracking table filling up. We have re-run these
tests many times but the results remained consistent. Manually bypassing the
iptables connection tracking table using -j NOTRACK iptables rules
immediately fixes this issue for the baseline and improves performance
to 200K connections/s as well. So there is clear evidence that the iptables
connection tracking table can start to struggle once above some threshold.
Note: The results for the Calico eBPF datapath have been unstable in this test. We are not sure why. The network packet flow was not steady. We are therefore not including the results because they are probably not accurate. We invite the Calico team to work with us to investigate this and then re-test.
Handling 200K connections/s is impressive given we have a standard, unmodified application handling these requests and transmitting actual information but let's look at the cost on the CPU side:
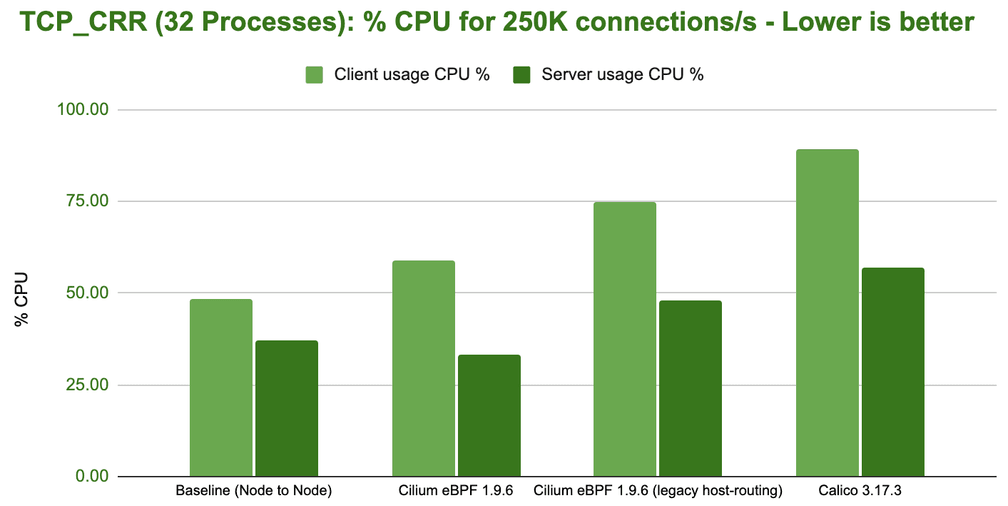
This benchmark outlines the biggest difference between the various configurations. In order to handle 250K new connections per second, the overall system has to spend anywhere from 33% to 90% of the available resources.
Based on the consistent difference between the required CPU for the sender and the receiver, it's also safe to assume that you can typically accept more connections per second than you can initiate.
The Cost of Encryption - Wireguard vs IPsec
Everybody will expect Wireguard to outperform IPsec so let's look at Wireguard first and see how Wireguard performance is tied to the configured MTU:
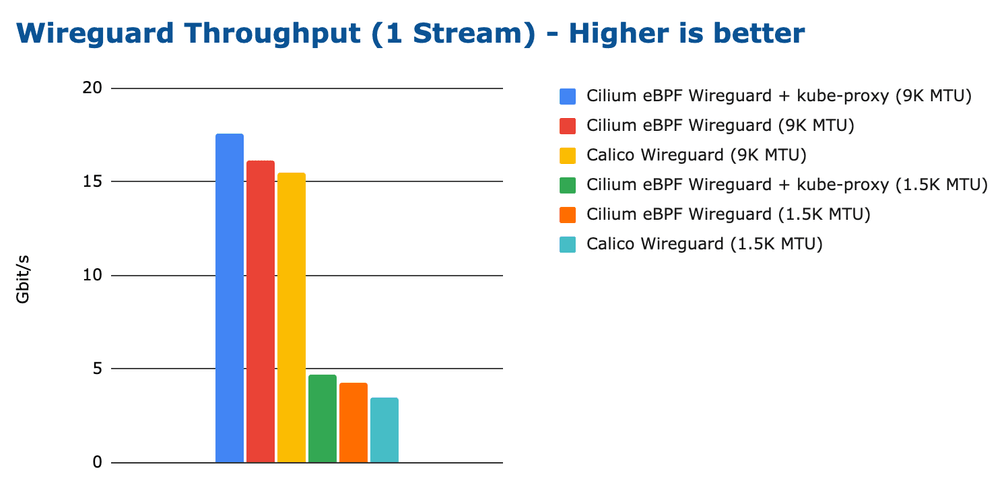
There is some difference between the configurations and interestingly Cilium in combination with kube-proxy performs better than Cilium without kube-proxy. However, the differences are relatively minor and most of the difference can be recovered by optimizing the MTU.
How does the CPU resources side look like:
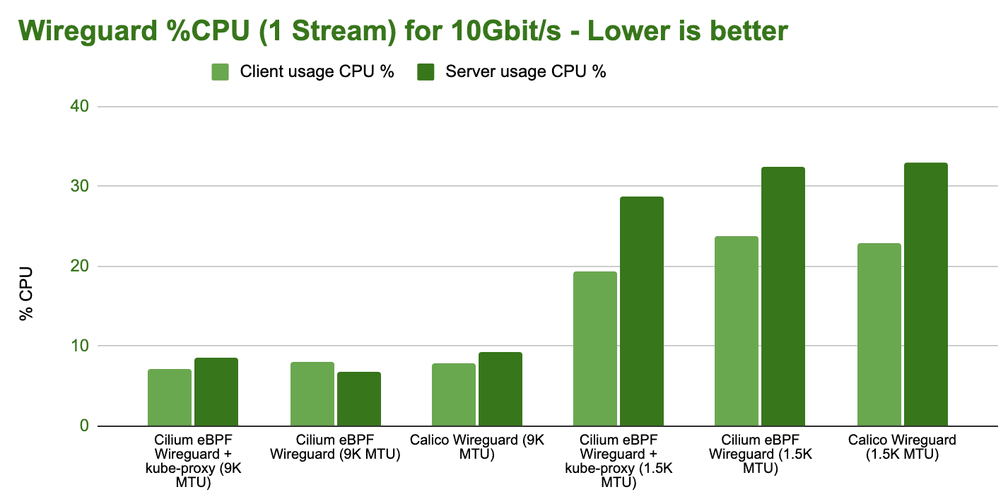
No major differences really. Configure your MTU correctly. We have also performed requests per second tests in our benchmarks but they show more of the same. No major differences. If you are interested, you can find them in the CNI Performance Benchmark section of the Cilium documentation.
Wireguard vs IPsec
Comparing the performance of Wireguard with IPsec is a more interesting test. Cilium has supported IPsec for a while and starting with Cilium 1.10, Cilium now also supports Wireguard. So it's interesting to compare the two next to each other while all other aspects are the same:
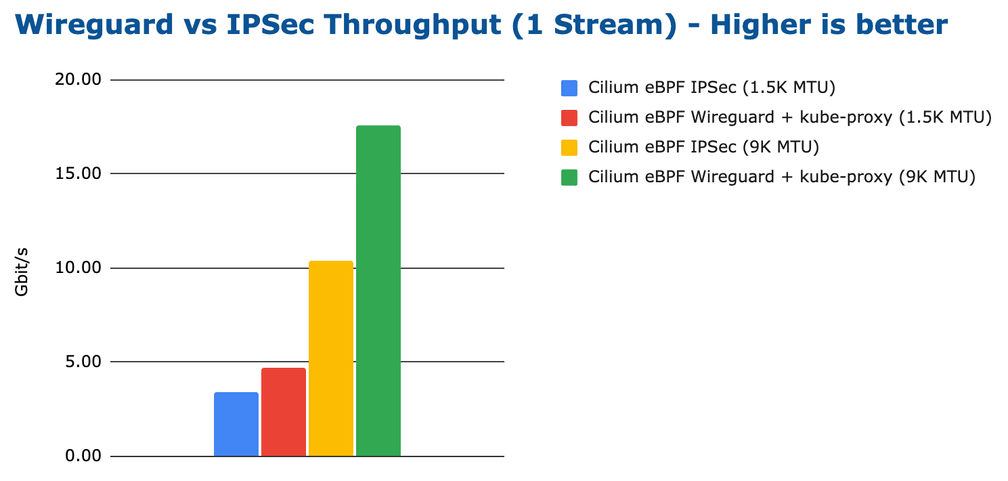
The above results is likely what everybody was expecting. Wireguard is achieving a higher throughput. Again, depending on the MTU but for both MTU configurations, Wireguard is able to achieve a higher maximum transfer rate.
However, let's look at the CPU resources required to achieve 10Gbit/s:
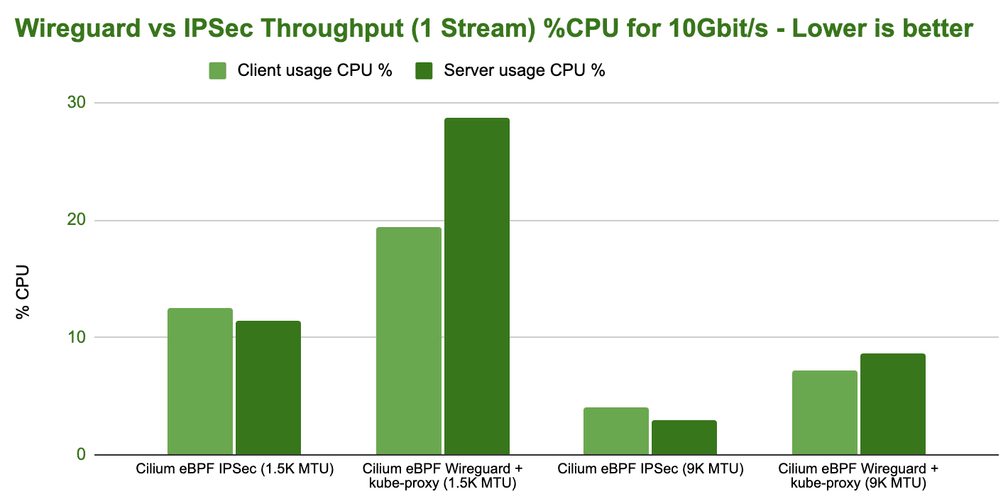
While Wireguard is able to achieve a higher maximum, IPsec is more efficient in achieving the same throughput. The difference is actually quite severe.
Note: To achieve this efficiency with IPsec, you strictly need hardware that supports AES-NI instructions in order to offload IPsec encryption.
Future work scheduled: It's not entirely clear to us yet why the higher efficiency of IPsec does not translate to a higher throughput as well. Also, throwing additional CPU cores at the problem doesn't significantly improve the performance. This is likely because RSS can't scale out well across cores for encrypted traffic since the L4 information typically used to hash and distribute flows across cores is encrypted and not available. Therefore, all connections will look the same from a hashing perspective as only two IP addresses are utilized in the benchmark.
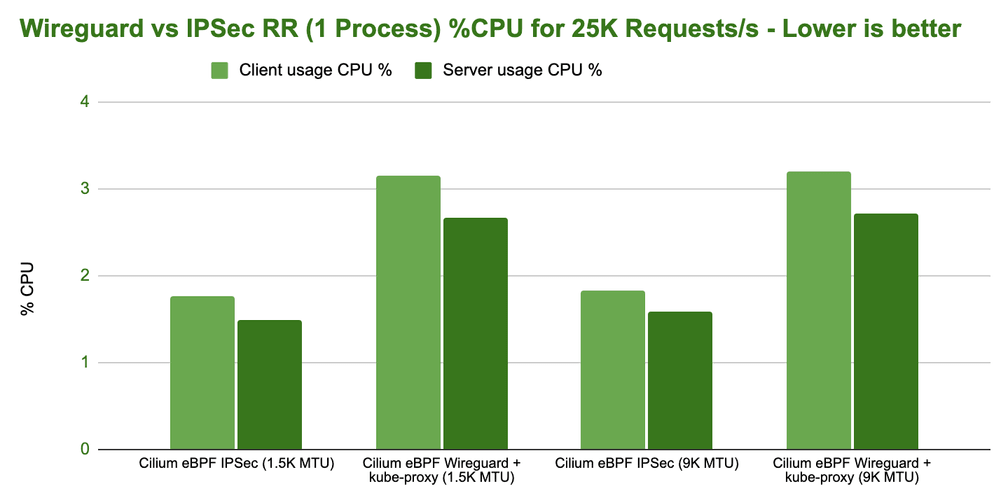
Does this also affect the latency? Let's have a look. Remember that the latency benchmark is the one that most accurately describes microservices style workloads where persistent connections are used to exchange requests and responses.
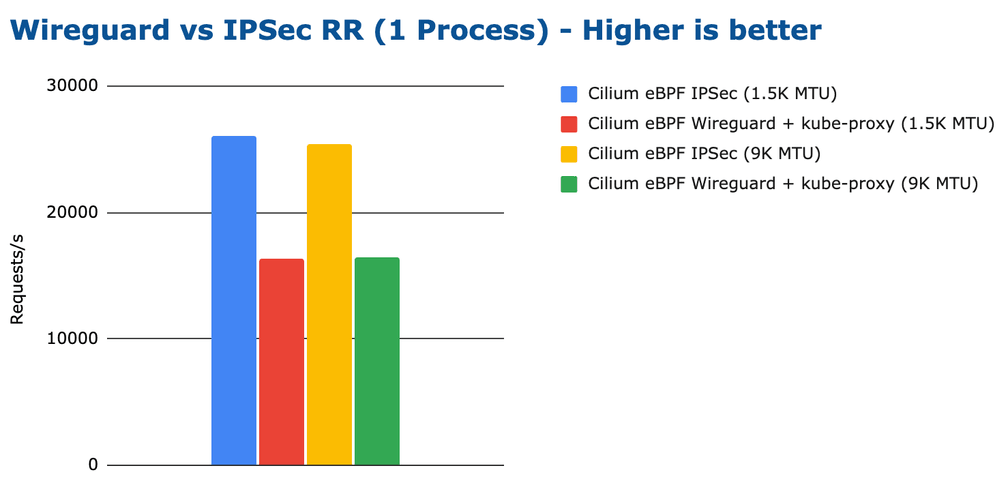
The CPU efficiency is in line with the observed requests per second but overall, none of the configurations consume a considerable amount of total CPU. The difference in latency is much more significant than the consumed CPU:
Performance Impact of Sidecars on a Service Mesh
Besides avoiding the sheer amount of proxies that need to be run in a sidecar service mesh model, a significant advantage of sidecarless service mesh is that we can avoid requiring running two proxies in between any connection. More details about Cilium's sidecarless service mesh can be found in this blog Next-Generation Mutual Authentication with Cilium Service Mesh
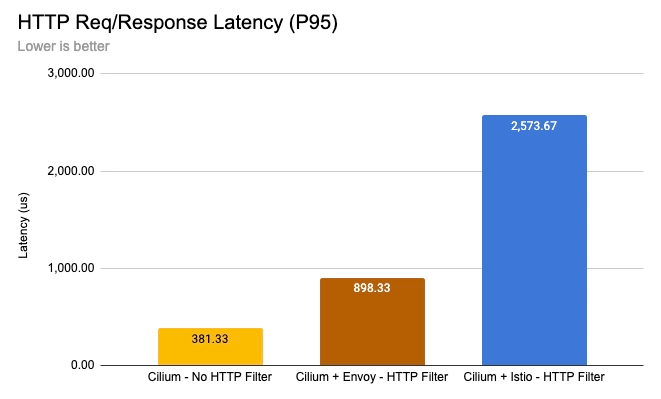
Reducing the number of proxies in the network path and choosing the type of Envoy filter has a significant impact on performance. The above benchmark illustrates the latency cost of HTTP processing with a single Envoy proxy running the Cilium Envoy filter (brown) compared to a two-sidecar Envoy model running the Istio Envoy filter (blue). Yellow is the baseline latency with no proxy and no HTTP processing performed.
Test Environment
This is the spec of our bare metal, off-the-shelf test environment. Two identical systems are used. The systems are directly connected to each other.
- CPU: AMD Ryzen 9 3950x, AM4 platform, 3.5GHz, 16 cores / 32 threads
- Mainboard: x570 Aorus Master, PCIe 4.0 x16 support
- Memory: HyperX Fury DDR4-3200 128GB, XMP clocked to 3.2GHz
- Network Card: Intel E810-CQDA2, dual port, 100Gbit/s per port, PCIe 4.0 x16
- Kernel: Linux 5.10 LTS (built with
CONFIG_PREEMPT_NONE)
All tests have been performed using a standard MTU of 1500 unless explicitly called out. While it is of course possible to achieve better absolute numbers with a higher MTU, the purpose of these benchmarks is to outline relative differences and not the highest or lowest absolute numbers.
Test Configurations
Upon popular request, we have included measurements for Calico for comparisons. We have therefore measured with the following configurations to allow for the best possible comparison:
-
Baseline (Node to Node): In this configuration, no Kubernetes or containers are used. The benchmark is performed by directly running
netperfon the bare metal machine. Typically this will produce the best possible result. -
Cilium eBPF: Cilium 1.9.6 running as described in the tuning guide with eBPF host-routing, and kube-proxy replacement enabled. This configuration requires a modern kernel (>=5.10). From a comparison and requirements perspective, this configuration maps best to "Calico eBPF". We have focused on benchmarking in a direct routing configuration as this is where performance typically matters most. We will extend the benchmarking for tunneling modes as well later on.
-
Cilium eBPF (legacy host-routing): Cilium 1.9.6 running in legacy host-routing with standard kube-proxy supporting older kernels (>=4.9). From a comparison and requirements perspective, this configuration maps best to "Calico".
-
Calico eBPF: Calico 3.17.3 kernel with the eBPF datapath with kube-proxy replacement, connection-tracking bypass, and eBPF FIB lookup enabled. This configuration requires a modern kernel (>=5.3). From a comparison and requirements perspective, this configuration maps best to "Cilium eBPF"
-
Calico: Calico 3.17.3 running with standard kube-proxy supporting older kernels. From a comparison and requirements perspective, this configuration maps best to "Cilium eBPF (legacy host-routing)".
How to reproduce
All scripts required to reproduce the above numbers can be found in the git repository cilium/cilium-perf-networking.
What is Next?
We feel like we have already achieved a lot in optimizing performance, but we still have many ideas to pursue and will continue to improve the performance of all aspects of Cilium.
-
Benchmarking Observability: Benchmarking pure networking is nice but the cost of observability is where the real difference can be made. Whether it is for security or troubleshooting, observability will become key in your infrastructure and the cost paid for the visibility will differ greatly. eBPF is a great tool for observability and Cilium's Hubble allows to benefit from it. For this benchmark, we have disabled Hubble to make the numbers comparable to Calico. In a subsequent blog post, we'll benchmark and look at the CPU requirements for Hubble and how it compared to other similar systems.
-
Benchmarking Services & NetworkPolicy: The published benchmark results do not involve any NetworkPolicy or services. We have excluded both to keep the scope of this blog post somewhat under control. We will extend the results to include NetworkPolicy use cases as well as services for both east-west and north-south scenarios. If you can't wait, the Cilium 1.8 release blog already published some benchmark results and shows how the use of XDP and eBPF significantly improves performance.
On this note, we are still not happy with the CIDR rule performance aspect of NetworkPolicy. Our current architecture is optimized for a small number complex CIDRs with exceptions implemented using longest prefix match (LPM) tables. Several users seem to desire and benchmark large allow and deny lists of individual IPs. We will make this use case a priority as well and provide a hashtable-based implementation.
-
Memory Optimizations: We continue to optimize the memory footprint of Cilium. The majority of Cilium's memory footprint comes from eBPF map allocations. These are kernel-level data structures which are required for the network processing. For efficiency, eBPF maps are pre-sized so there is a minimal amount of required memory based on the configuration. This aspect is not as ideal as we would want it right now so it will be a focus of ours in future releases.
-
Breaking More Rules - Bypassing More iptables: In our opinion, you can't bypass enough iptables until you eventually get rid of it entirely. There is still optimization potential in the container namespace and other parts of the system. We are also continuing work to accelerate service mesh datapath applications, an initial version of this is already available using socket-level redirection for Envoy. Expect more to come in this area.
-
Other Ideas? Do you have other ideas? Let us know! What would you like us to benchmark or improve on? We are eager to hear your thoughts. Drops us a line on the Cilium Slack or reach out to us on Twitter.
Further Reading
- All of the above numbers have been published in the CNI Performance Benchmark section of the Cilium documentation and we will continuously update this.
- All the instructions on how to tune Cilium for performance can be found in the Tuning Guide.
- To learn more about Cilium, check out the What is Cilium? documentation.
- To learn more about eBPF check out the eBPF.io website.
